Borrow the Weekly Report, Not the Numbers
For store owners, ops leads, and anyone who has ever been sent a beautiful weekly review and thought: I want that, but for my shops.
A friend in the same trade sends you a link on a Sunday night.
It's their weekly store review. Three paragraphs, no dashboard, no attachments — revenue against last week, which site carried the growth, which one went quiet, what the payment mix says about the weekend. It reads like the report you keep meaning to write and never do.
You open it. It's good. And then you hit the same wall you always hit: it's their week. Their stores, their categories, their numbers. Useful as a template, useless as an answer.
What you want isn't their revenue figure. You want the thing behind it — the questions they thought to ask, the way they define "revenue" in the first place, the fact that they always check the quiet store before the loud one. That part is transferable. That part is what Remix copies.

What actually gets copied
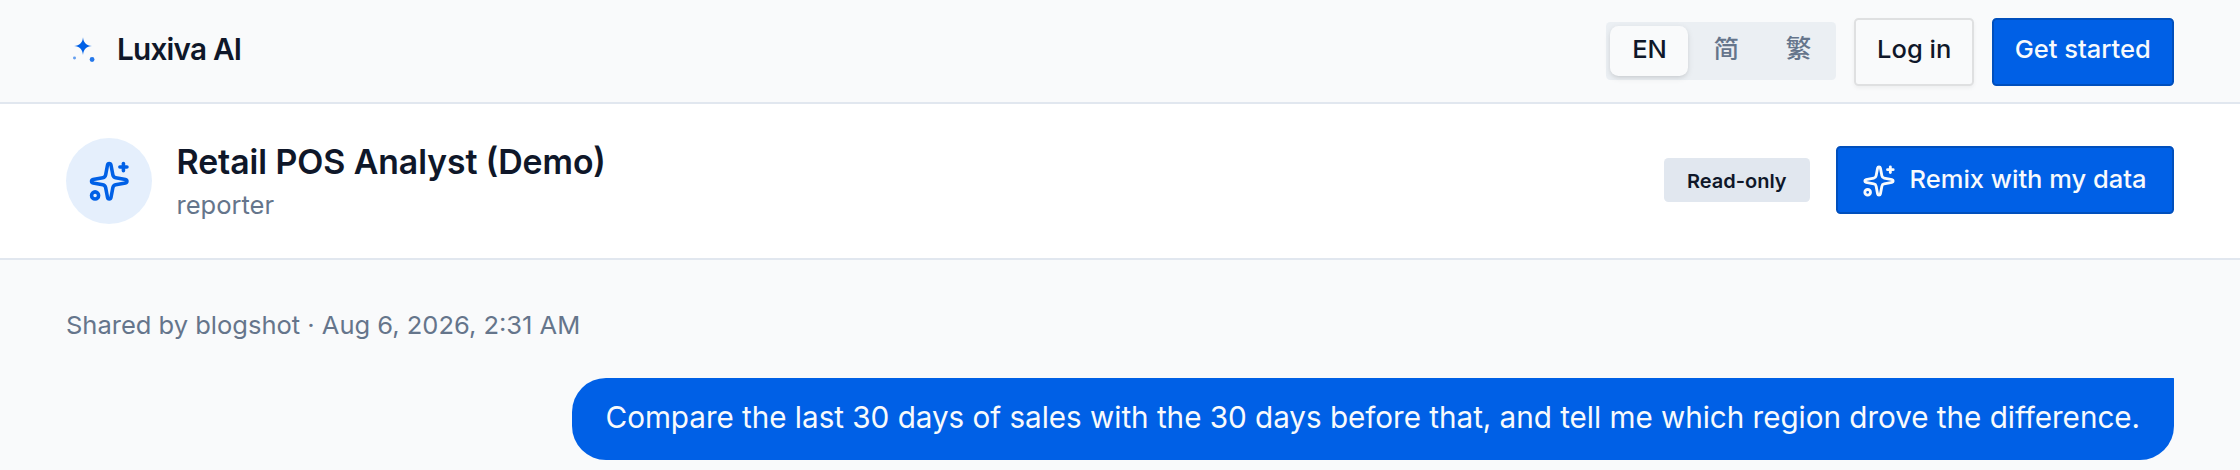
A shared result in Luxiva is a read-only snapshot: the question, the answer, and the metrics the answer leaned on. You can see that the weekly review runs on Total Revenue, Transaction Count, Average Units Sold and a payment breakdown. You cannot see a single row of the sharer's data, and no amount of clicking will get you there.
"Remix with my data" takes that snapshot and rebuilds it around your file:
- The questions come across. Same weekly review, same follow-ups, same instinct to compare against the week before.
- The definitions come across. If their revenue metric excludes refunds, that judgement travels with it.
- The data does not. Your spreadsheet is ingested into your workspace. The person who shared the link never sees it, never gets notified about it, and has no route to it.
You end up with your own agent — one you own, can rename, can edit, and can share onward if you want to.
The one thing software can't decide for you
Here is where most "just import it" features quietly fall over.
Their spreadsheet says value and product_category. Yours says gross_revenue, net_revenue and dept. Same business, different vocabulary — because your point-of-sale system was configured by a different person in a different year for different reasons.
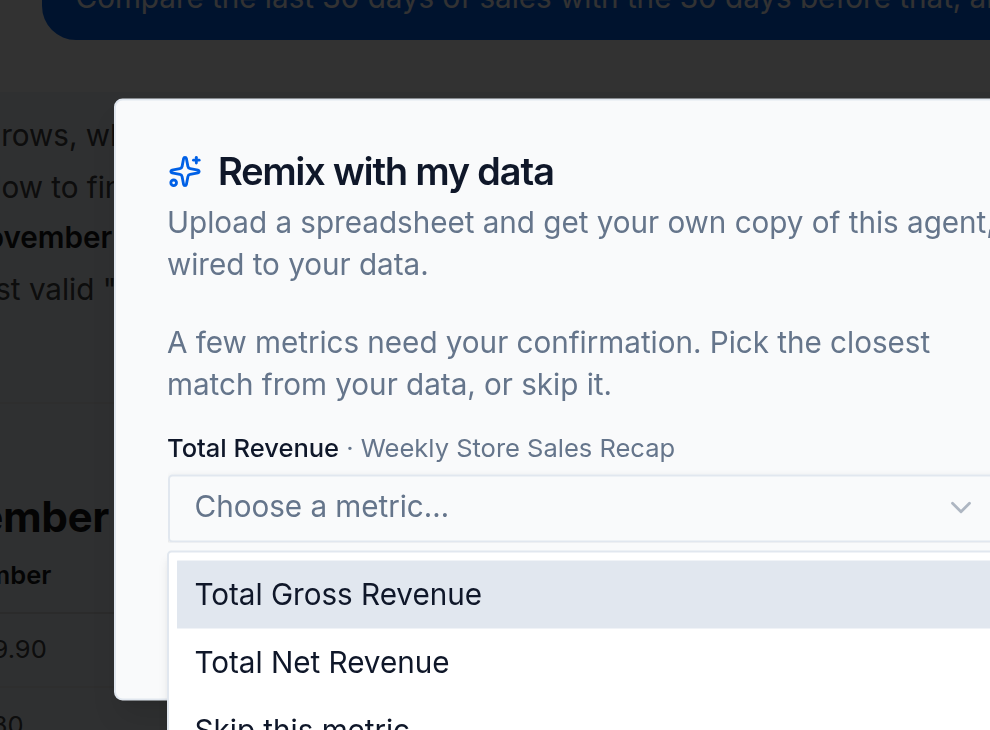
Luxiva resolves what it can. Its metric matching is deliberately boring and deterministic: an identical metric ID wins outright; otherwise names and IDs are compared word by word, with the underlying columns counted for a smaller share. A candidate needs a minimum score to count at all, and has to beat the runner-up by a clear margin before it gets applied silently.
Most requirements resolve on their own. Some don't — and the honest answer is that they shouldn't.
Your file has two revenue columns. Gross and net score exactly the same against a metric called "Total Revenue", because on the evidence available they are equally good answers. Only you know whether your weekly review means the money that came through the till or the money you kept after discounts and returns. So that is the one question you get asked.
Walk through it yourself
The walkthrough below is a simulation of that exact flow, running entirely in your browser. No account, no upload, no credits — and the spreadsheet it works from is one you can download and open, so you can check every number it reports.
Push it to the end, then replay it and answer the mapping question the other way. The report changes.
remix-simulator
Why that one question is worth asking
In the sample fortnight, gross revenue is flat week over week. Net revenue is down five and a half percent. Both are true. The promo week pulled the same money over the counter and gave a chunk of it back in discounts.
Map "Total Revenue" to gross and your agent tells you the week held steady. Map it to net and it tells you the week cost you margin. Neither answer is wrong; one of them is yours.
That is why the mapping screen exists, and why it is deliberately the only manual step. Everything that can be settled by evidence is settled before you see it. The thing that requires knowing your own business is handed back to you — once, in plain language, with a skip button for when you'd rather decide later.
What you're left holding
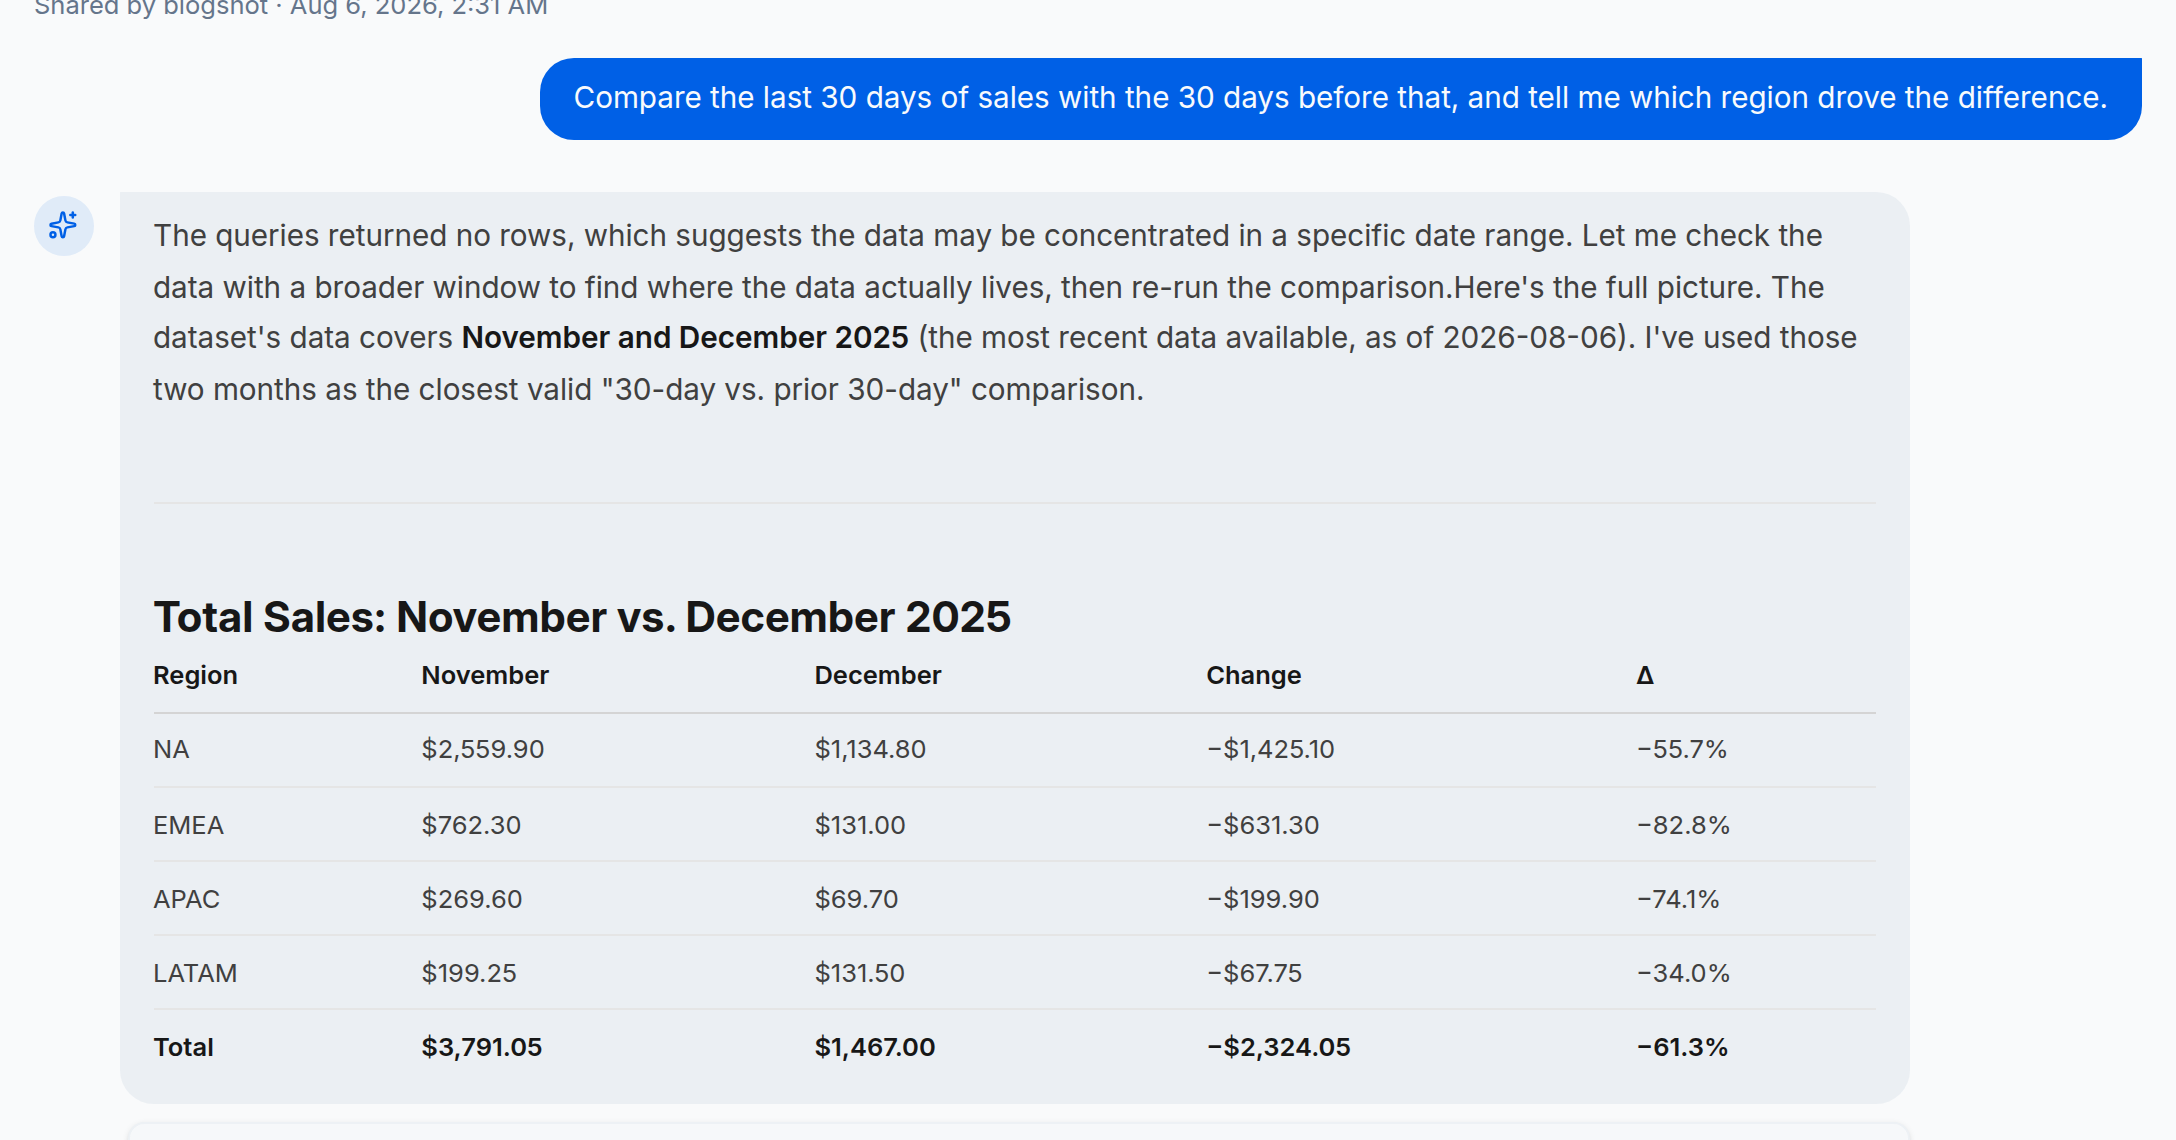
A copy of the agent, in your workspace, pointed at your dataset. You can change the questions it asks, tighten the definitions, add your own thresholds, and next week upload a fresh export and ask again.
The person you remixed from carries on with their week and never knows the difference. You skipped the part where you stare at a blank page trying to remember what a good weekly review is supposed to contain.
Borrow the judgement. Keep your numbers.
remix-demo-cta
Luxiva turns a spreadsheet and a good question into an agent your whole team can ask. Remix is how a good question travels.